Rather listen? Simply hit the play button and listen to the article in full
Chris Haswell - CSPA pensions Cases Manager
Chris Haswell looks at how pensions fare around the world. This article was first published in The Pensioner magazine.
For a long time, UK governments have focused on British pensioners relying on occupational pensions for their retirement. The state has even had part of the state pension paid through occupational schemes – which happened when members of decent schemes such as the public service schemes were drawn into ‘contracting out’.
This meant paying less National Insurance, with the ‘guaranteed minimum pension’ element of the state pension paid through your occupational scheme. People in different or no occupational schemes paid more NI for the state earningsrelated element of the state pension.
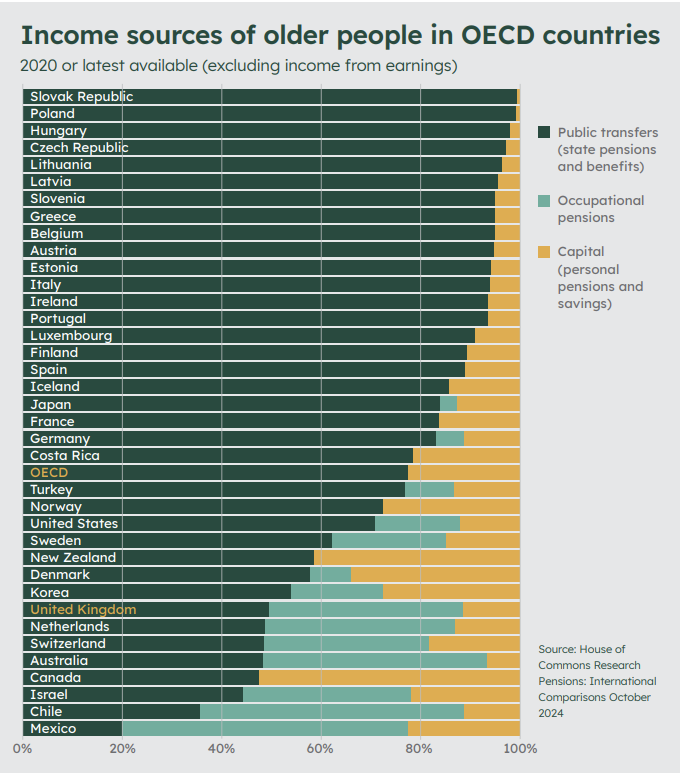
House of Commons research in 2024 explored comparisons with other OECD countries. A key takeaway is that the UK devotes a smaller percentage of its GDP to state pensions and pensioner benefits than most other advanced economies.
Comparing state pensions alone shows the UK provides less pension than most other advanced economies relative to average earnings. The UK has an overall net replacement rate of 54.4% from mandatory pensions for an average earner; the OECD average is 61.4%. But occupational schemes, which pay part of the state pension, aren’t included.
The study highlights three sources of income: Europe’s model of social insurance and general taxation; the UK’s focus on occupational pensions (since 2008 people have been automatically enrolled into occupational schemes); and voluntary private pension savings.
In the UK, about half of pensioner income comes from state provision; in 15 out of 36 countries in the study, nine tenths of pensioner income comes from the state. The table shows a real mix of countries with a similar reliance on occupational pensions. Many more rely on the state.
The UK is always going to look like it has poor provision. But that doesn’t mean when occupational and personal pensions are included provision is good. Not everyone has had access to occupational schemes or has worked or been credited the qualifying years.
Ireland has a flat rate of pension based on contributions, but public sector pensions are heavily entwined. So the rate is a bit higher than the UK at around £230 per week. In the Netherlands the amount is similar, linked to the minimum wage – 70 per cent for a single person, 50 per cent each for a couple. In Denmark it is £167 per week and then means tested up to a whopping £360 for a single pensioner.
GDP spending
A good comparison is how much of GDP is spent on pensioners. For the UK it is low at 4.7 per cent in the latest figures. The USA is 6.6 per cent, Germany almost 10 per cent, France over 10 per cent and Greece over 13 per cent. The number of people of pension age will influence this, of course, but it indicates national priorities.
Replacement rate is another way of comparing pensions as a percentage of former salary. Using a private sector worker on an average salary, again Denmark and the Netherlands do well, with a large percentage of salary replaced by pension. The UK is also high on that table, but does this reflect low pay?
In another study comparing pension systems, the UK did well. But once again, Denmark and the Netherlands did better. The Netherlands has ‘collective defined contribution pensions’ – those are new here (so far only for Royal Mail), but they have had mixed reviews there.
Pensioner poverty is the last factor the report looks at and the UK has a pensioner poverty rate of 14.5 per cent compared with 11.7 per cent of the population overall – just above mid-table in the study
Rather listen? Simply hit the play button and listen to the article in full